CT lung CAD may require adjustment from radiologists
By Eric Barnes, AuntMinnie.com staff writer
June 26, 2015 — Computer-aided detection (CAD) for CT lung exams will be essential in the coming era of population-based lung cancer screening. But radiologists may have to change their way of reading studies to reap its benefits, according to a recent talk by Dr. Geoffrey Rubin from Duke University.
For one thing, radiologists will achieve better nodule detection by first reviewing CT lung scans without CAD assistance. It also helps if readers know how to reconstruct images and which nodules to report, Rubin said in a talk earlier this month at the International Symposium on Multidetector-Row CT in San Francisco.
What’s more, users of CT lung CAD will need to become up-and-down data “drillers” rather than side-to-side “scanners,” as they work their way through the images, according to the results of one study Rubin and colleagues performed. And when they turn CAD on, they should read thick sections and leave the thin sections to CAD as second reader; this saves time but, as it turns out, does not sacrifice much in the way of accuracy.
“How people search nodules is really quite variable, and developing a systematic approach in an undisturbed environment is really helpful for maximizing your effectiveness,” Rubin said.

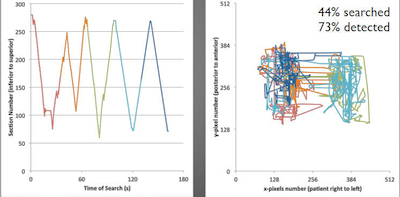
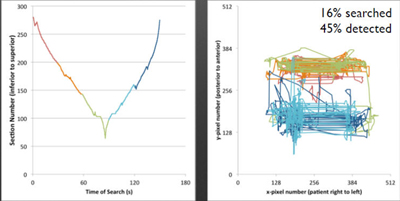
Images above represent the “driller” reading paradigm; images below represent the “scanner” paradigm. Upper left, driller reads different lung regions in a more efficient manner than a scanner (bottom left), who moves left to right and back in a scattershot approach, repeating some regions and neglecting others. The driller covers more anatomy and finds more nodules (upper right) than the scanner (lower right). All images courtesy of Dr. Geoffrey Rubin.

What are you looking at?
With the coming deluge of CT lung screening exams, detecting all nodules through unassisted reading of transverse sections is impossible, Rubin said. Therefore, CAD use is the best way to detect more clinically significant nodules, and CAD software “should become a critical element for interpretation once standards for its use are developed and we see more radiologist-friendly workflows.”

Dr. Geoffrey Rubin from Duke University.
Readers must first ensure they’re reporting clinically relevant nodules, meaning lesions at least 4 mm in diameter on incidence screens and at least 6 mm on prevalence screens, Rubin said. Is the nodule solid, part-solid, ground glass, calcified, spheroid, or flat? All of these characteristics affect the risk of malignancy. Solid and part-solid are the riskier lesions.
Aiming to determine what kind of reading style generates the best screening results, Rubin and his team at Duke performed a gaze-tracking study that measured the percentage of clinically relevant lung nodules that readers of varying experience levels detected.
It turned out that “drillers” — those who read up and down from left to right in a systematic fashion — significantly outperformed the “scanners,” who read left to right from the top to the bottom of the lung volume, Rubin said.
In fact, the drillers ended up searching 44% of the anatomy and detecting 73% of the nodules, whereas the scanners searched just 16% of the anatomy and detected 45% of the nodules.
Thin-slab MIPs
The choice of reconstruction is also important. A stacked cine review of thin (< 2 mm) sections on a PACS viewing station is standard practice, "but I suspect that many people ... find thin-slab [maximum intensity projections (MIPs)] in the transverse plane more beneficial," Rubin said.
Thin-slab MIPs can really make nodules stand out, as long as the slabs aren’t made too thick, a practice that can lead to overlapping blood vessels, he said. Most settle for MIP thicknesses of about 5 mm.
A 2006 study in European Radiology showed that the detection of small solid nodules benefited more from MIPs than ground-glass opacities. Also, the transverse plane has been found to be more effective for searching than the coronal plane, and less-experienced readers appear to benefit most from MIPs.
Optimizing CAD use
CAD brings many advantages to reading, but the technology does have a handful of drawbacks, Rubin said.
“When one uses CAD as a second reader, we know that more nodules are detected and interobserver variability is substantially reduced, and the beauty of a computer is that it’s inexhaustible,” he said. “It also offers the possibility of predicting lesions, and facilitating longitudinal tracking of those lesions.”
On the other hand, CAD as a second reader prolongs interpretation time, and it creates false-positive detections that the radiologist must dismiss, a process that can be “time-consuming and frustrating,” Rubin said.
There are also potential blind spots to CAD algorithms depending on nodule location; for example, it can be difficult to see juxtamediastinal lesions or nodules attached to blood vessels. Nodule composition can also affect CAD performance.
“Ideally, you’d like to have a system that is appropriately tuned for the task of nodules you’d want to find; however, most systems seem to be a one-size-fits-all model of CAD detection,” Rubin said.
“What, exactly, we are willing to pay,” Rubin asked, to obtain the enhanced sensitivity with CAD reading, realize its full benefit, and then validate and quantify that benefit?
Thick-section reading vs. thin?
An article by Godoy et al in the American Journal of Roentgenology (January 2013, Vol. 200:1, pp. 74-83) explored the idea of making CAD more efficient by letting readers look at thick sections rather than thin, Rubin explained.
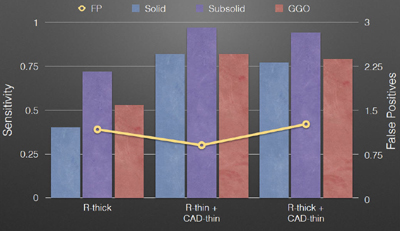
Godoy and colleagues studied two approaches: First, four readers reviewed thin sections and then CAD marks, and after a few months, they reviewed thick sections and then CAD marks. The researchers also estimated sensitivity for reading thick sections with CAD marks on thin sections.
They looked at 155 nodules — 74 solid, 22 part-solid, and 59 ground-glass opacities — that had an average diameter of 5 mm (range, 4.0-27.5 mm). The group found that adding CAD led to substantial improvements in sensitivity, but there was little difference between reading thin or thick sections.
“CAD allowed the readers to be more efficient by reading thick sections and still detecting essentially the same number of lesions,” Rubin said.

Radiologists can efficiently read lung cancer screening CT scans by interpreting thick sections and leaving the thin sections to CAD, resulting in almost no loss of sensitivity and few additional false positives. The chart, courtesy of Dr. Geoffrey Rubin, was derived from data in table 2 of Godoy et al (AJR, January 2013, Vol. 200:1, pp. 74-83).
A study by Christe et al in the European Journal of Radiology compared three commercial CAD systems using phantoms and revealed substantial differences in sensitivity between the systems. The study highlighted the very different performance characteristics of different CAD applications (December 2013, Vol. 82:12, pp. e873-e878).
“It’s very important to understand that not all systems are created equal,” Rubin said.
“We’re on the cusp of having CAD available,” he concluded, noting that Europe is ahead of the U.S. in the approval and deployment of lung nodule algorithms.
“It will be very valuable to us, but it’s just [being] introduced in clinical practice, so we need to pay attention to the actual performance of what we have in hand,” he said.
